2.9 KiB
Report
Question 1
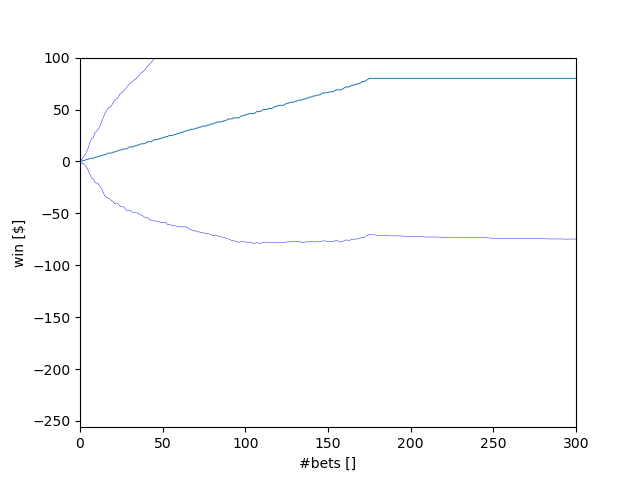
In Experiment 1, estimate the probability of winning $80 within 1000 sequential bets. Explain your reasoning thoroughly.
The betting strategy in experiment 1 generates $1 for every win and effectively does not create a loss for an incorrect bet. That means we have to lose 921 times to win less than $80. The odds for that are (20/38)^921, or one could also say non-existent.
Question 2
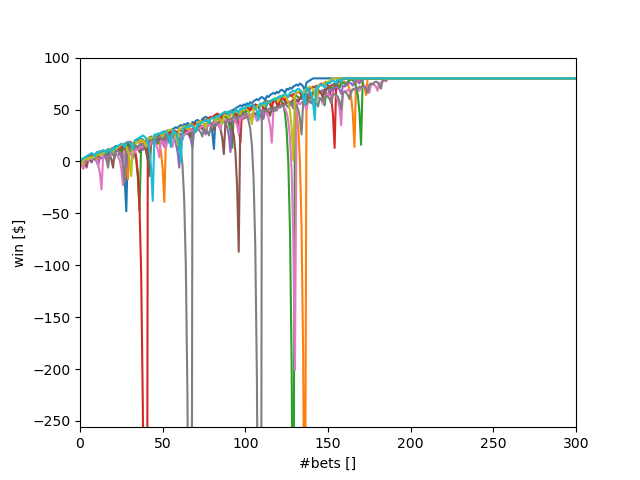
In Experiment 1, what is the estimated expected value of our winnings after 1000 sequential bets? Explain your reasoning thoroughly.
Based on the previous answer's reasoning, we have an expected value of $1 times 18/38 or $0.47 per bet. That means the expected value is $470 for 1000 consecutive bets. Since the limit is $80, all graphs end at that value. If we increase the limit to $1000 and change the graph's dimensions, we can see that $470 is the area where the winnings graphs end.
Question 3
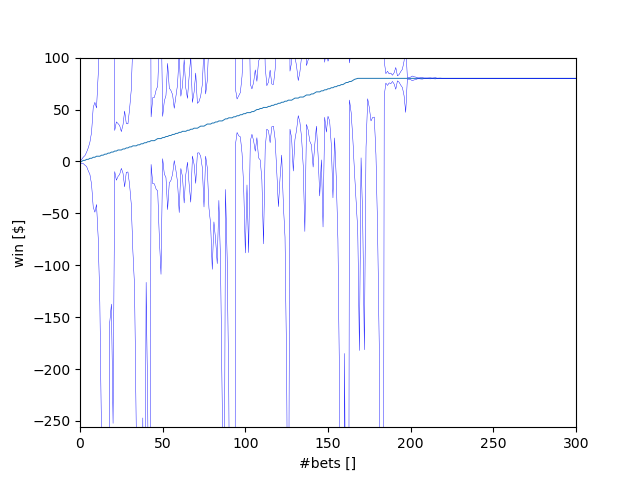
In Experiment 1, does the standard deviation reach a maximum value then stabilize or converge as the number of sequential bets increases? Explain why it does (or does not) thoroughly.
The more sequential bets reach their final value of $80, the more the standard deviation stabilizes and eventually goes to zero. The more bets are ongoing, the higher the chances that one of them goes on a losing streak, which results in a significant standard deviation. Therefore, the maximum standard deviation is likely to occur between the first couple of bets (so that a losing streak can build up), but before many bets reach $80.

Question 4
In Experiment 2, estimate the probability of winning $80 within 1000 sequential bets. Explain your reasoning using the experiment thoroughly. (not based on plots)
We start at $256. After losing eight times (nine times if we have already built some bankroll), we go bankrupt. Consequently, we are at 0.59% ((20 / 38) ** 8) risk to lose everything for each dollar we want to earn. Therefore, the probability of winning $80 is 0.9941^80 or 62.34%.
Question 5
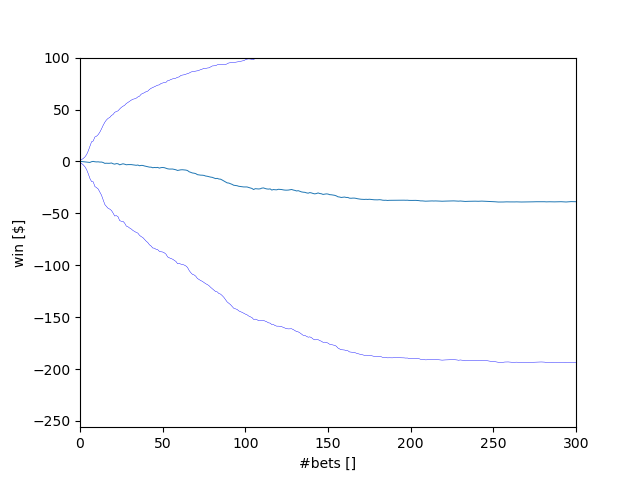
In Experiment 2, what is the estimated expected value of our winnings after 1000 sequential bets? Explain your reasoning thoroughly. (not based on plots)
According to the previous question's answer, we have a 62.34% chance to win $80, which leaves us with 27.66% to lose $256. Accordingly, the expected value is 0.6234 * $80 - 0.3766 * $256 = -$46.53. This result seems to match our experiment. After 300 bets, we are on average at -$40, and when we extend the timescale to 1000 bets, the graph converges towards $45.
Question 6
In Experiment 2, does the standard deviation reach a maximum value then stabilize or converge as the number of sequential bets increases? Explain why it does (or does not) thoroughly.
The standard deviation reaches a maximum value and stabilizes once all runs have either bankrupted or reached the $80 goal.